Understanding the Dashboard interface
You are first presented with the Dashboard interface upon logging in to Epiphan Live. The Dashboard interface contains many helpful elements used for confidence monitoring and streaming/recording control, described in the Elements in the Dashboard interface table below.
The Dashboard view is responsive and automatically adjusts and repositions its elements to fit cleanly within any size web browser window.
Elements in the Dashboard interface
| Number | Title | Description |
|---|---|---|
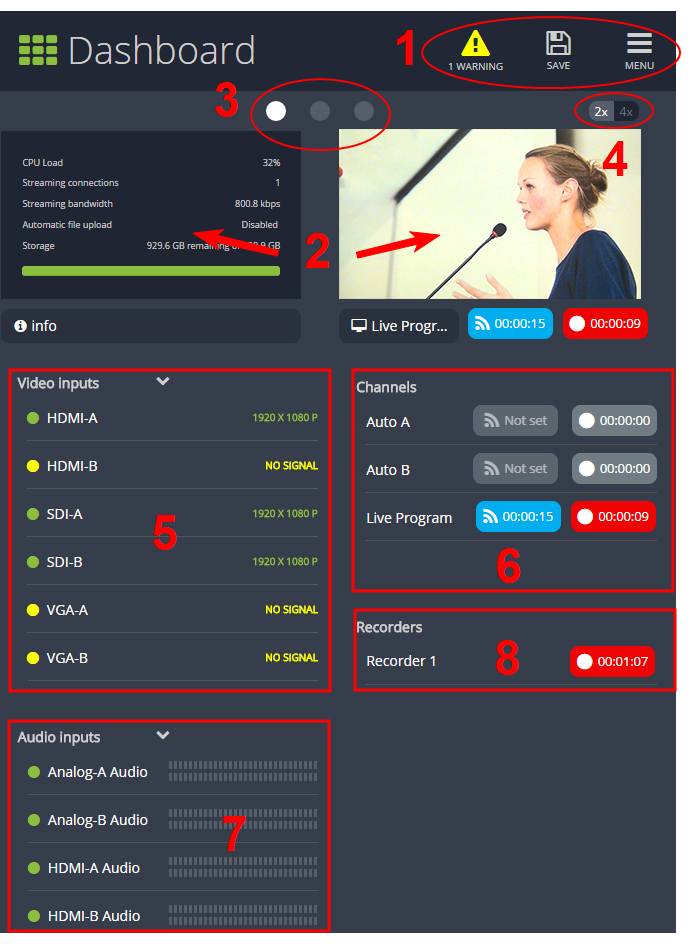
| 1 | Dashboard header icons |
Note that you need to press Save to preserve your layout setting. When a layout is saved, all other operators and administrators will see your configured Dashboard layout when they log in or refresh their Epiphan Live page.
|
| 2 | Dashboard monitoring panels | Configurable panels used for confidence monitoring. You can set each panel to display a source, channel, output or basic system information. Note that the Dashboard monitoring panels appears blank by default when logging in for the first time. |
| 3 | Dashboard panel navigation icons | Click to navigate between three different sets of Dashboard monitoring panels. The illuminated icon represents your currently displayed panel set. |
| 4 | Dashboard panel set quantity icons |
|
| 5 | Video inputs | Displays a list of your video inputs configured in the Admin panel and includes basic status information for each input. |
| Channels | Displays a list of your channels configured in the Admin panel and includes streaming and recording control buttons for each channel. | |
| Audio inputs | Displays a list of your audio inputs configured in the Admin panel. Includes basic status information and a VU meter for each input. | |
| Recorders | Displays a list of your recorders configured in the Admin panel and includes a recording control button for each recorder. |
