Pearl Mini User Guide
The Dashboard interface
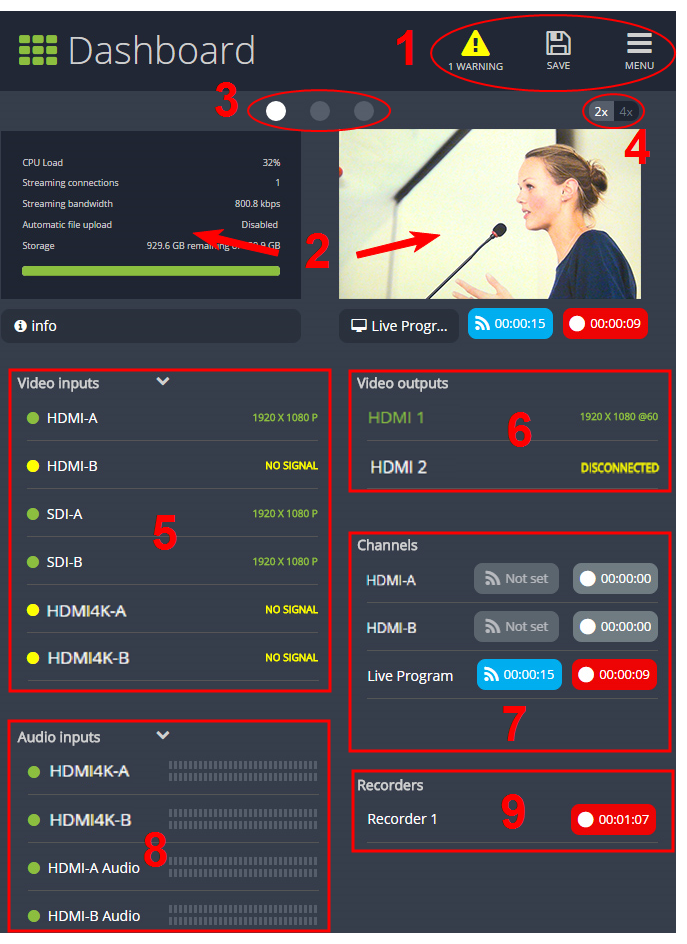
The Dashboard interface is the first page you see when you open Epiphan Live. You'll find helpful tools for confidence monitoring, as well as streaming and recording control.
Elements in the Dashboard interface
| Number | Title | Description |
|---|---|---|
| 1 | Dashboard header icons |
Tap Save to preserve the current layout. Logged in operators and administrators will see the latest Dashboard layout when they refresh their Epiphan Live page. The latest saved layout displays the next time you log in.
|
| 2 | Dashboard monitoring panels | Configurable panels for confidence monitoring. You can set each panel to display a source, channel, output, or basic system information. Panels are empty by default. |
| 3 | Dashboard panel navigation icons |
Each dot represents a set of panels. Select a dot to navigate between the three different sets of Dashboard monitoring panels. |
| 4 | Dashboard panel set quantity icons |
|
| 5 | Video inputs | Displays a list of your video inputs configured in the Admin panel and includes basic status information for each input. |
| 6 | Video outputs | Displays a list of your video outputs configured in the Admin panel and includes basic status information for each output. |
| 7 | Channels | Displays a list of your channels configured in the Admin panel and includes streaming and recording control buttons for each channel, as well as individual control buttons for each stream when you set up multiple streams in a channel. |
| 8 | Audio inputs | Displays a list of your audio inputs configured in the Admin panel. Includes basic status information and a VU meter for each input. |
| 9 | Recorders | Displays a list of your recorders configured in the Admin panel and includes a recording control button for each recorder. |
