The touchscreen channel view
Each channel you configure on Pearl device can be monitored and controlled using the touch screen. After you power on the Pearl device and the grid view opens, you can select a channel and open the channel view. Just tap the channel you want in the grid view and the channel view opens.
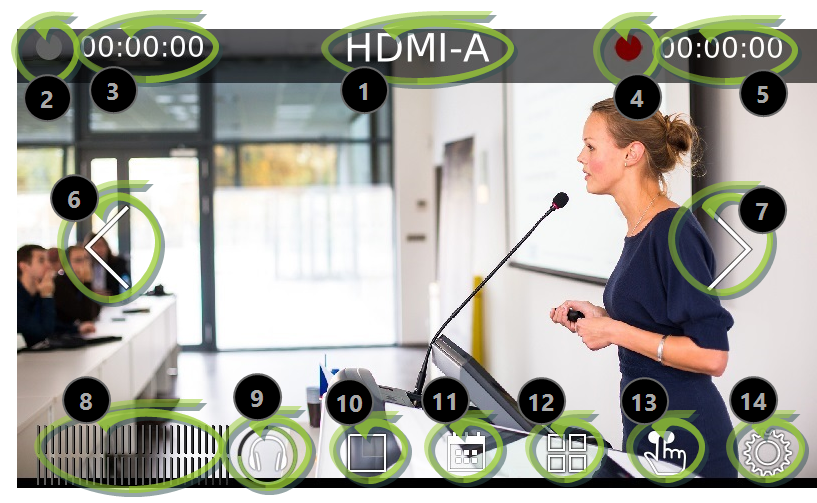
Parts of the touch screen for the individual channel view
| Item | Description |
|---|---|
| 1 | Channel name. |
| 2 | Streaming status. Gray means streaming is stopped, flashing blue means streaming is in progress. |
| 3 | The streaming timer shows the length of time that streaming has been in progress. |
| 4 | Recording status. Bright red and flashing means recording is in progress. |
| 5 | The recording timer shows the length of time that recording has been in progress. |
| 6 and 7 | Controls to switch between channels. Tap the arrow to view the next (or previous) channel. The arrow icons fade when the touch screen is idle (i.e. untouched) for several seconds. Tap the touch screen and the icons reappear. |
| 8 |
Audio VU meter uses quasi-peak ballistics with samples averaged every 10 ms. The maximum average audio level in each 100 ms period is displayed using colored bars.
|
| 9 | Audio monitoring volume control icon. Tap to change volume level. See Monitoring audio for more information. |
| 10 | Live Switcher view icon. Tap to view the live switcher, which lets you live switch between different custom layouts that are configured for the channel. |
| 11 | CMS Events screen icon. Tap to view the status of scheduled Kaltura or Panopto CMS events or to authenticate with your CMS and create an unscheduled ad hoc event, see Create ad hoc events using the Admin panel. |
| 12 |
Grid view icon. Tap to view all the configured channels in a grid. |
| 13 | Single touch streaming and recording control icon. See Single Touch streaming and recording control |
| 14 | System settings icon. See View system information using the touch screen. |
